Michigan Data Interface
The Michigan Data Interface (MDI) is a standardized framework for developing, installing and running HPC data analysis pipelines and interactive R Shiny visualization applications.
These pages describe the MDI project overall. Links within lead you to documentation for specific components, e.g., how to get started writing your own tool suites.
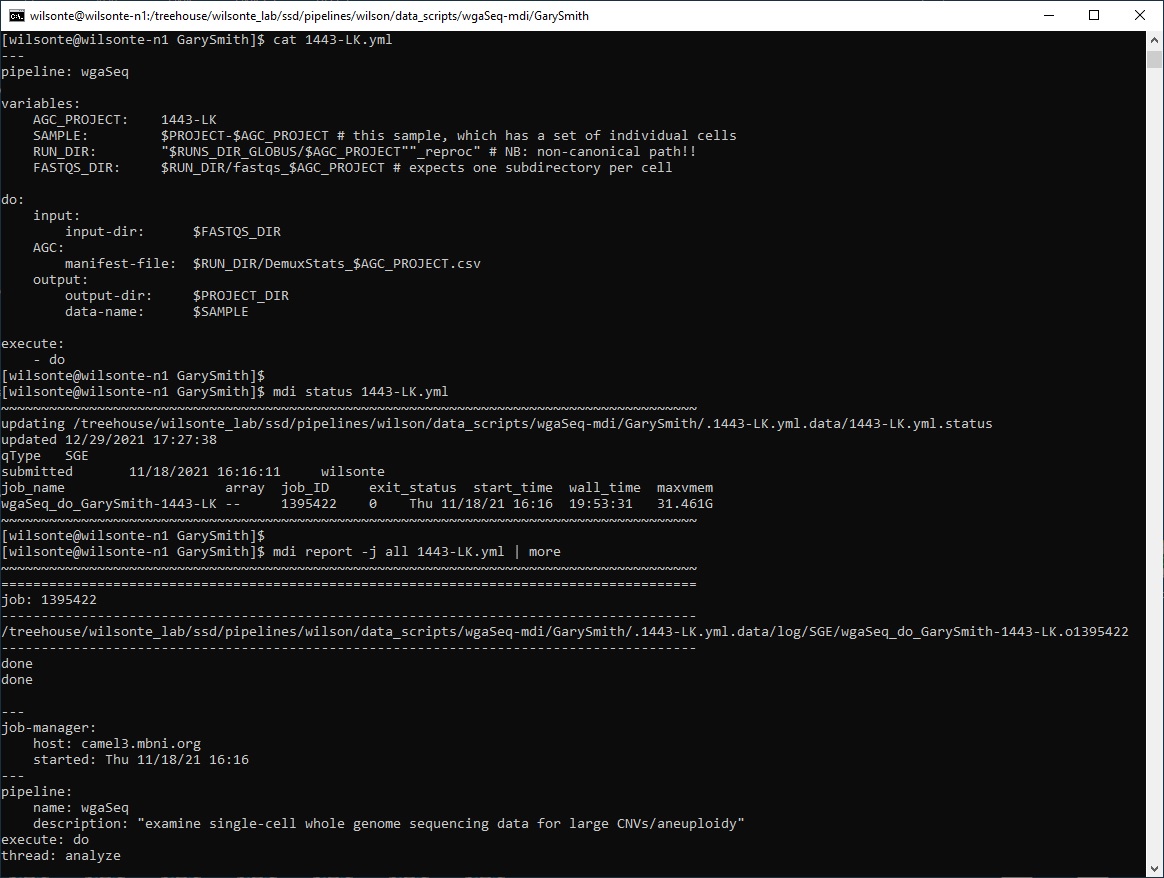
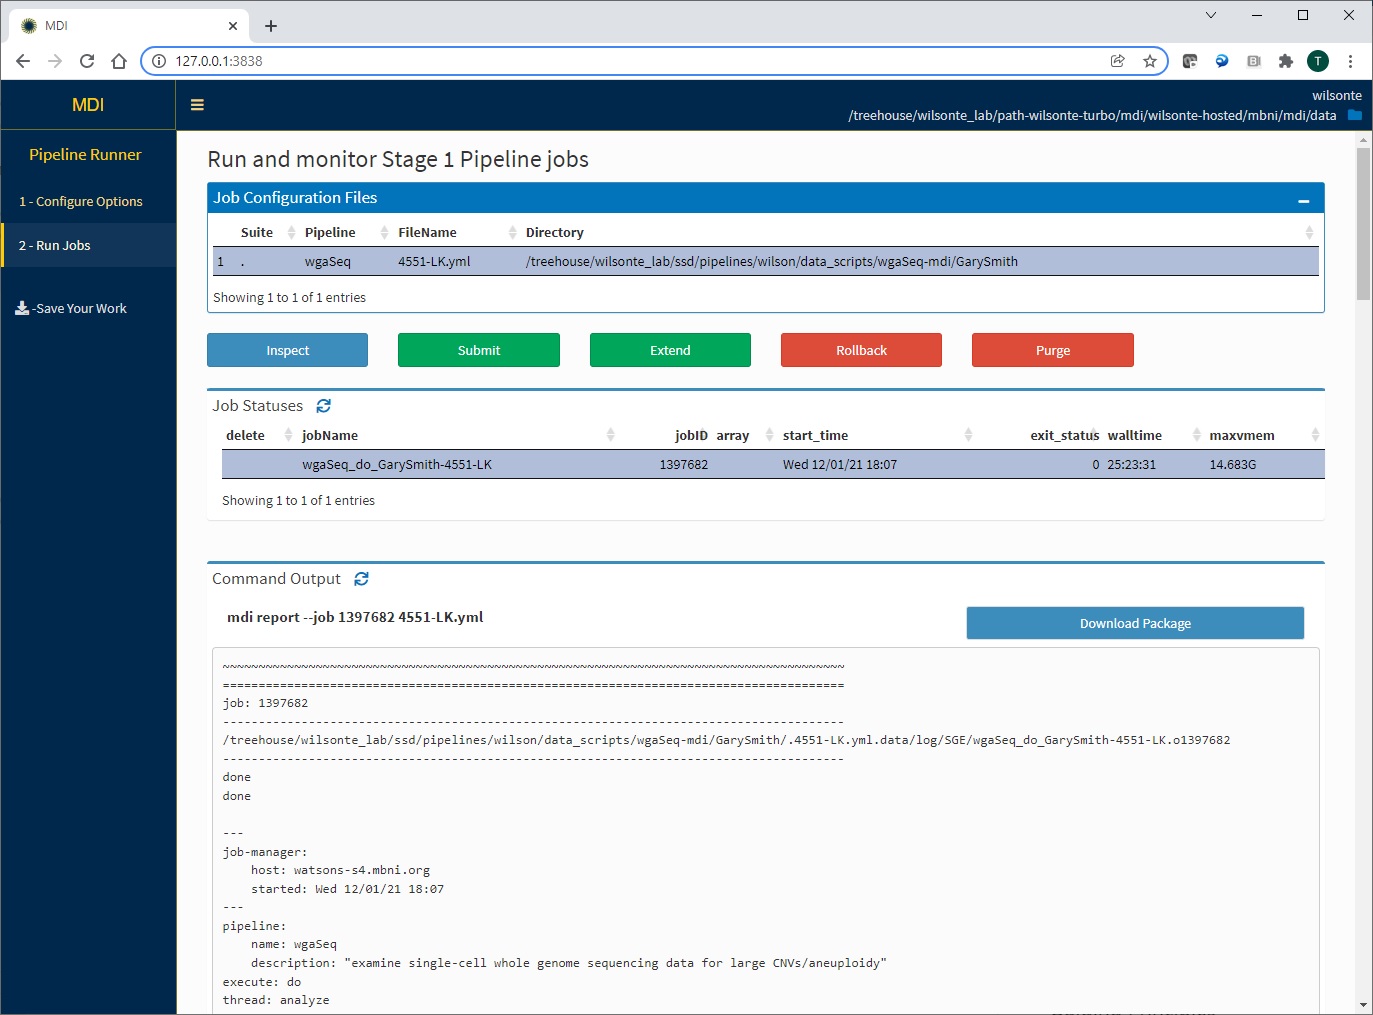
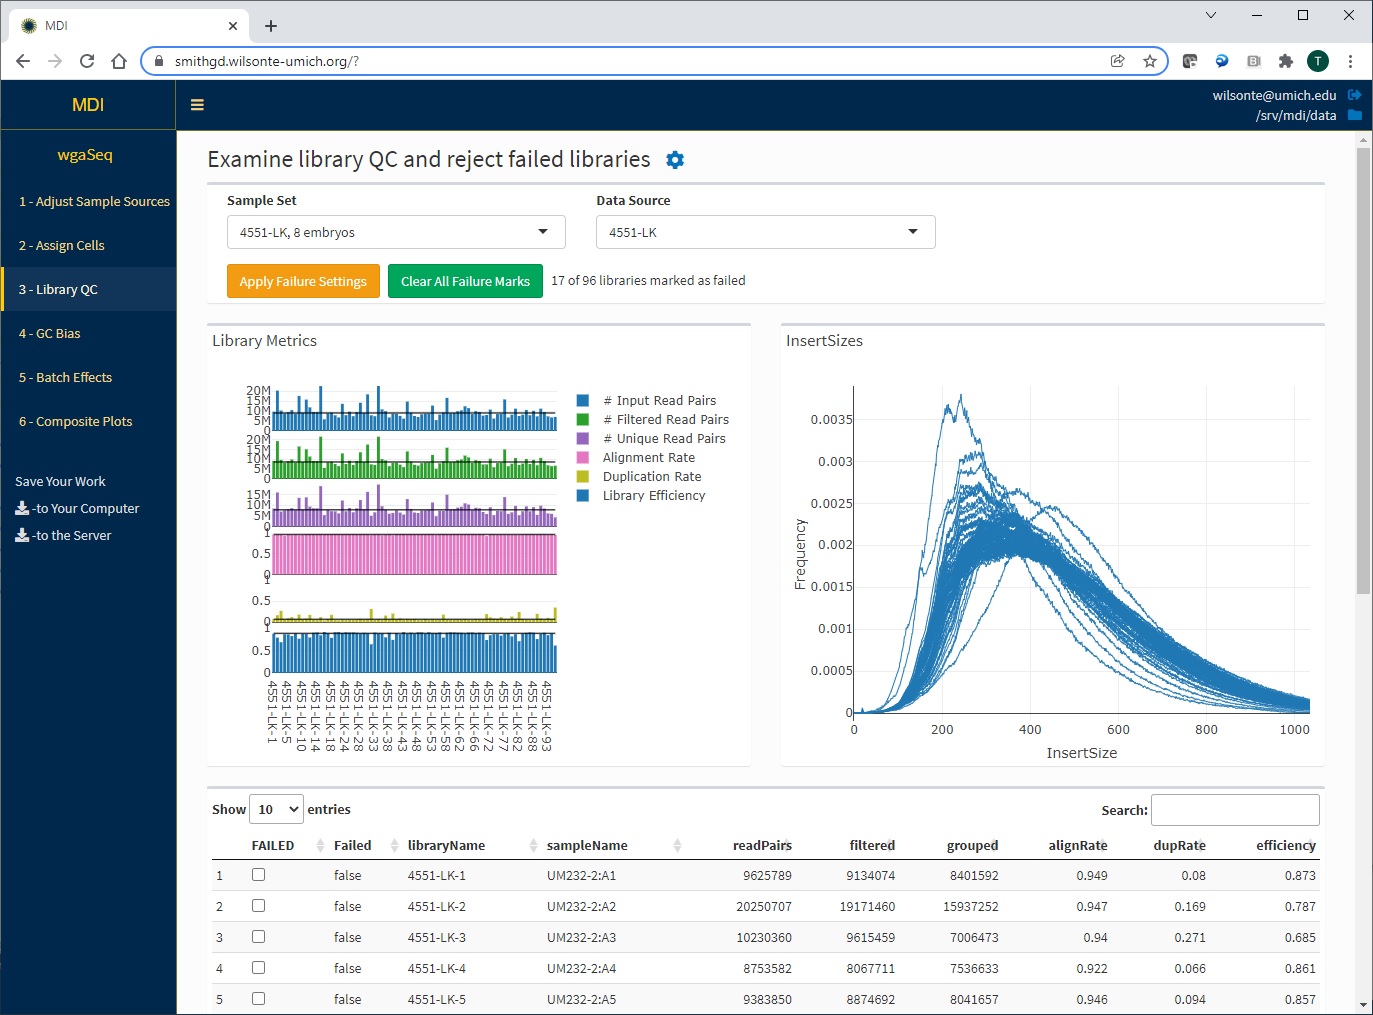
Screenshots
Video Overviews
Quick Start
Follow these instructions to clone and install the MDI command line interface on an HPC server:
Install the MDI Desktop, a program that helps you connect to a server and run MDI apps from your Windows or Mac computer:
Tool developers should start by copying our repository suite template and following its documentation:
See the following for a barebones summary of the structure of job, pipeline, and app configuration files:
Live App Demo
To try out this repository’s live demo app server:
- go to: https://mdi-demo.wilsonte-umich.io/
- enter the access key:
mdi-demo - click
Load from Serverand select a data package or bookmark to load
Guiding Principles
- effective, streamlined use of modern development tools
- optimal use of scalable computation resources
- rapid collaboration, code sharing, and community building
- interactive data analysis
- standardized implementation frameworks
- maximum developer flexibility
Our goal is to help you develop and share robust data analysis tools more easily, or to use tools developed by others, without forcing too many requirements into the process.
Basic Training for Developers
Please see our Basic Training tutorials in the link below if you need help getting started with Git, the command line, job schedulers, R, Shiny, etc.
Portability and Licensing
The MDI can be used by any laboratory or organization for any data analysis need under the MIT license. A few instructions are specific to the University of Michigan environment but the codebase is generic.
For more information about the MDI, please visit:
MDI Documentation MDI Basic Training MDI GitHub page


