Analysis Stages
The MDI manages data analysis flow in two stages depicted below. Users and developers may be interested in working with either or both stages.
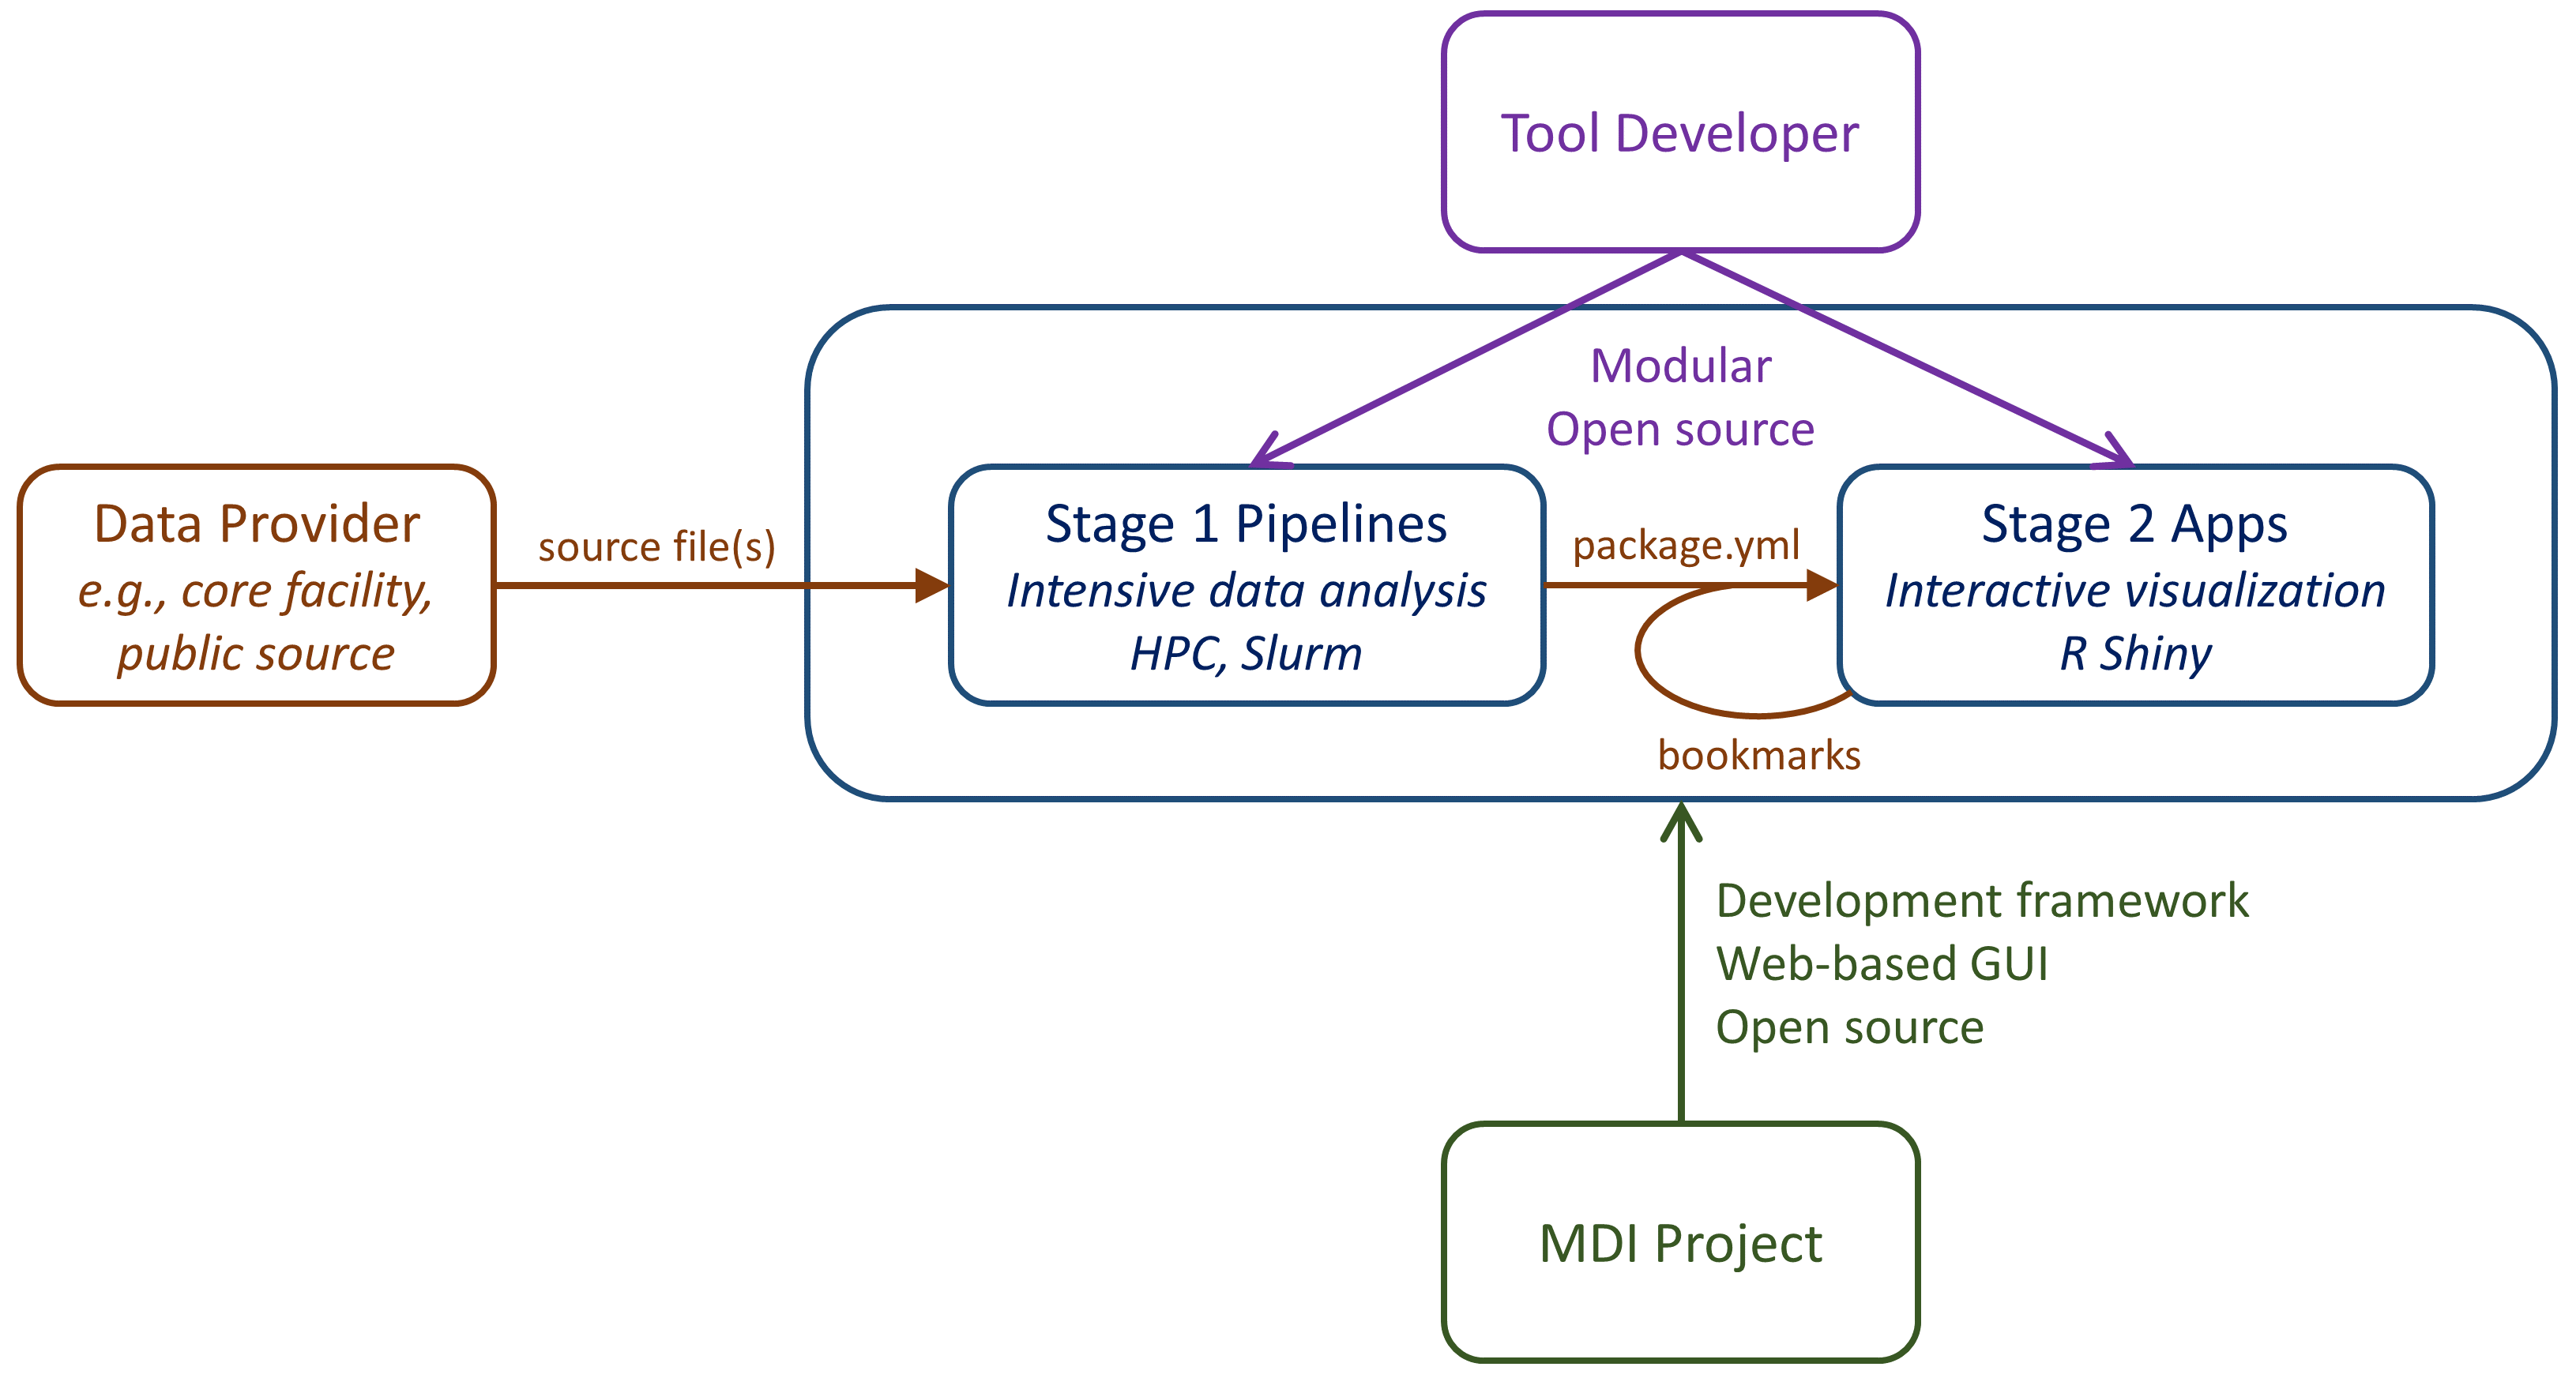
Stage 1: HPC Pipelines
We use ‘pipeline’ synonymously with ‘workflow’ to refer to a series of
analysis actions coordinated by scripts. Stage 1 pipelines are typically:
- sample autonomous, i.e., they are executed “per sample”
- executed once on an input data set, not iteratively
- executed the same way on every sample, regardless of the experiment
- hands-off, i.e., not interactive
- resource intensive, in storage and/or CPU needs
- executed on a high-performance computing (HPC) cluster
- dependent on large input data files
- capable of producing smaller output data files
The above properties make Stage 1 pipelines well suited to being run by a core facility or data producer according to best practices. They are ideal for a cluster server, which the ‘mdi’ command line utility helps manage.
Examples of Stage 1 pipeline actions are bulk image processing, training of machine learning algorithms, and read alignment to a genome.
The MDI pipelines framework does not encode data analysis pipelines themselves, which are found in other code repositories called ‘tool suites’. Instead, the framework encodes script utilities that:
- allow YAML configuration files to be used to define a pipeline
- wrap pipelines in a common command-line interface (CLI)
- coordinate pipeline job submission to HPC schedulers
Stage 2: Visualization Apps
Stage 2 applications, or “apps”, support interactive, graphical data visualization characterized by:
- lower resource needs
- execution by end users via a web interface
- iterative execution, with adjustments for hypothesis testing, etc.
- execution per sample set, project, etc. (i.e., multiple samples)
- a need for the user’s detailed knowledge of the project
- common analytical approaches applied to variable study designs
- smaller processed data files as input
- publication-ready images and other files as output
Examples of Stage 2 apps are R Shiny web tools that make interactive graphs and tables. Once again, the MDI framework does not carry the tools themselves, it provides a common web interface where MDI apps from different tool suites can be easily loaded and developed.